Token spend tracks how much engineers use AI agents, not what they ship
A five-week study of 404 engineers at JetBrains finds that an engineer's AI token bill says little about how much code they commit. The paper is a preprint and has not been peer reviewed.

What the study shows
Coding agents are AI tools that read code, run commands and make changes for an engineer. Their providers bill by the token, a small unit of text the model reads or writes. An engineer's token spend is the total of those units over a period.
The authors are from Carnegie Mellon University, JetBrains and the University of California, Irvine. They linked five weeks of token counts from JetBrains' internal AI gateway to the commits of 404 engineers. A commit is a saved change to the code. They also analysed an anonymous company survey of 412 employees about AI use.
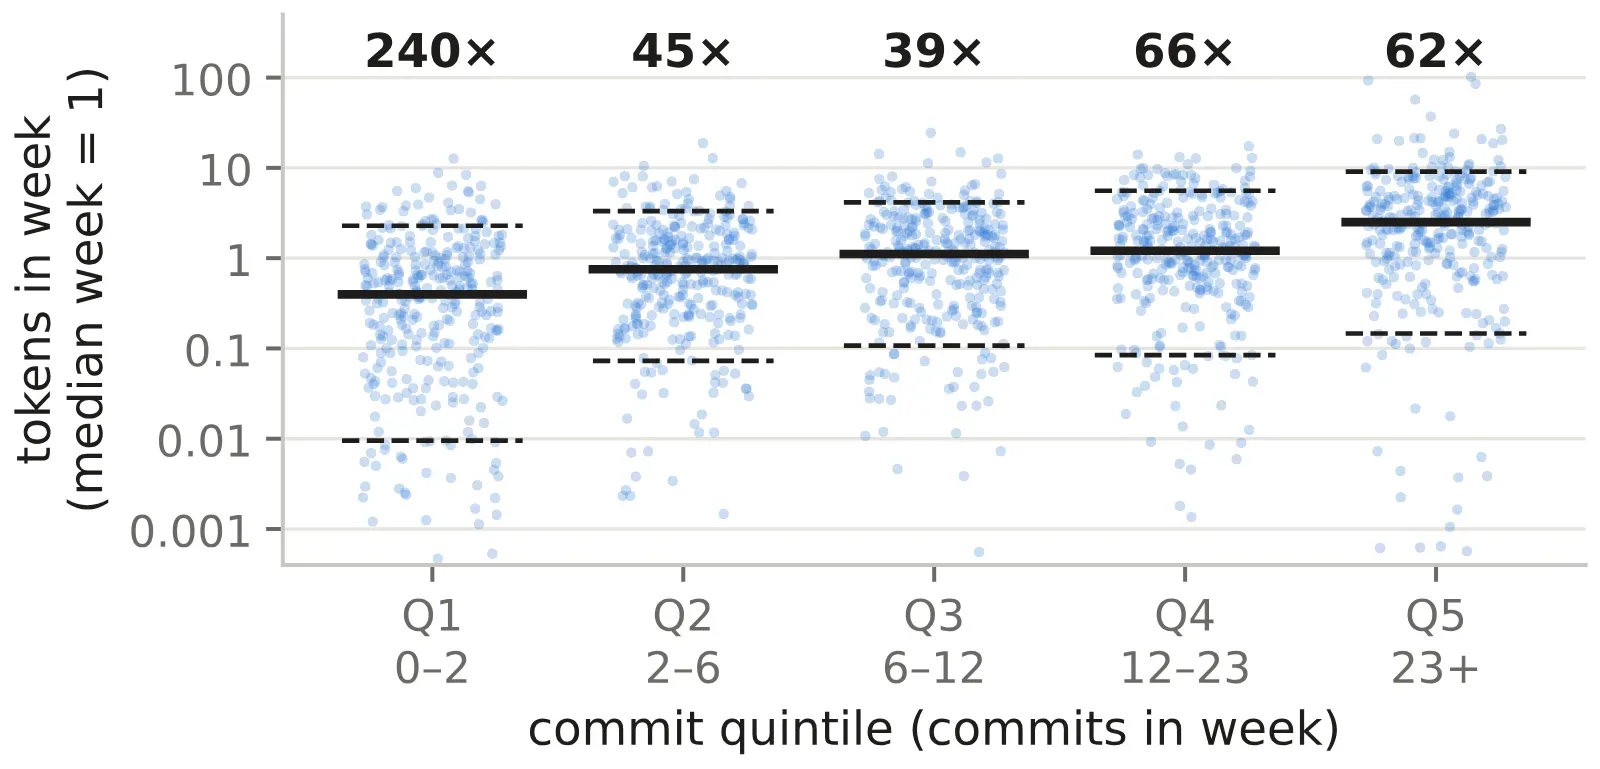
The main comparison holds each engineer fixed and compares their weeks with one another. The authors report that a week with twice an engineer's usual spend had only about 10% more commits. If spend tracked output closely, doubling one would roughly double the other.
The authors tested several explanations for the weak link. They tried lines changed instead of commits, days instead of weeks, and allowed for delays between spend and commits. None of these closed the gap.
Spend varied far more between people than with their output. Among weeks with similar commit counts, the heaviest-spending tenth used 39 to 240 times the tokens of the lightest tenth. Commit-based measures explained under two fifths of the differences between engineers. Role and team added nothing useful.
The authors estimate that between about 4% and about two fifths of spend does not vary with the week's commits. The upper figure also includes the fixed cost of using an agent at all and spend in weeks when the code was written by hand.
In the survey, technical staff said they had used the coding agents for something other than coding in nearly nine of ten evaluations. Common uses were data analysis, brainstorming, research and planning. Most reported saving time, and those with broader use reported saving more hours. These are self-reports.
The authors recommend using token spend only for resource accounting. They advise against using it to judge engineers' output or efficiency.
Our reading
In our reading, the comparison with lines of code holds up, with one twist. Lines of code at least count something produced. Tokens count an input, recorded whether or not anything useful comes out. A token spent on a prototype that shaped a design looks the same on the bill as one spent on output that was thrown away.
The study's strongest feature is its design. Earlier figures came mostly from analytics vendors comparing groups of heavy and light users. Those comparisons mix up the person with the spend. Here each engineer is compared with themselves, and the link is still weak. So the problem is not just that different engineers work differently.
A concrete example shows the risk. Suppose a manager divides an engineer's token bill by their commits to judge efficiency. In a busy week, the engineer will look about 40% more efficient without changing how they work. When a new model arrives, the same ratio can rise with no change in output, because newer models used more tokens for the same commits. The headline caveat is that these are associations at one company that builds AI coding tools.
Read the rest of this story
Membership is free. You get every article in full and the Issue every Sunday.
We send a sign-in link, no password needed. Already a member? Sign inReadiness assessment
| Level | Status | Evidence |
|---|---|---|
| I Lab only | Met | This is an empirical case study, with the analysis run on internal company records. |
| II Benchmarked | Met | Results are measured on real telemetry and commit data from 404 engineers, with sensitivity checks and bootstrap intervals. There is no public benchmark, so this level is met only loosely, as a measured empirical result rather than a benchmark score. |
| III Open source | Not yet | The replication package (github.com/CMUSTRUDEL/token-study-replication) has analysis scripts and supplementary material. The raw data and survey responses are not public. This is not a released tool, model or dataset. |
| IV In production | Not yet | The study measures how a metric behaves. No organisation is documented as adopting its recommendations. |
What would move it up
Releasing anonymised data, or a replication at other organisations with longer windows and pull request and quality outcomes, would strengthen it. Gateway records that link sessions to tasks would test the main claim directly. Documented adoption of the recommendations by a named organisation would support level 4.
Checked automatically every week, last on 16 November.
The study
Shyam Agarwal, Olga Lvova, Agnia Sergeyuk et al.. The AI Era's Lines of Code? A Case Study on What an Engineer's Token Spend Measures. arXiv, 10 November 2026. doi:10.48550/arxiv.2611.13396
Notes
- Agarwal, Lvova, Sergeyuk, Serova, Bryksin, Zimmermann and Vasilescu, 'The AI Era's Lines of Code? A Case Study on What an Engineer's Token Spend Measures', arXiv preprint, November 2026. Not peer reviewed. CC BY licence. Source
- Replication package with analysis scripts and supplementary material. Raw data and survey responses are not public; anonymised records may be available under a non-disclosure agreement. Source
- Within-engineer slope of commits on tokens: 0.13 (95% interval 0.03 to 0.32). Elasticity of tokens on commits: 0.26 (0.19 to 0.32). Instrumenting commits with lines changed raises it to 0.48.
- Commits, lines changed, bug-linked commits and commit-days explained 38% of between-engineer variation on held-out engineers and 13% of within-engineer variation on held-out weeks. The person alone explained 79% in sample. Role, manager flag and team together scored -6%.
- Share of spend not tied to output: floor about 4% (3.0% for above-median no-commit weeks); spline curve 39% (31% to 46%); log(1+x) 42%; raw counts 89%, which the authors rank worst on all diagnostics.
- Survey: 412 respondents (15.8% of employees). Of 167 technical coding-agent evaluations answering the use questions, 89% reported non-coding use; 91% reported saving time, median 10 hours in the past week.
- Five-week spend totals have projected rank reliability 0.87. Only 17 of 34 engineers in the top decile by tokens per commit in odd weeks were also in it in even weeks. Weeks fully on the newer model had about 45% more tokens at the same commit count.
- Survey costs: 31% of technical agent users reported higher cognitive load; 55% of 299 respondents reported handling colleagues' suspected AI-generated material, at a mean 1.6 hours a week.
Edited and signed by
Stefan PerdalEditor and publisher86 stories editedStefan read the study, set the readiness level and approved this story. An AI system found the paper and wrote the first draft.
How this was made
An AI model read the study and wrote this article in the structure Science Underway uses. An editor reviewed it and approved it for publication. Check the original study before you rely on the details.
How we workNo corrections