Google graph model cuts datacenter repair time on H100s and TPUs
In a live test at Google, a graph neural network diagnosed broken AI machines faster than a long-maintained rulebook. It cut mean repair time by about 16 to 18%. The paper is a preprint written by Google staff about Google's own system.

What the study shows
Large AI models are trained on thousands of linked machines. If one breaks, the whole job can stall. Each machine holds over 100 parts that can be swapped, such as chips, cables, memory and power supplies. Finding the faulty one quickly is hard, especially when several faults appear at once.
Until now, Google diagnosed these failures with a rules system. Engineers write hundreds of rules that add 'badness' scores to each part, and the part with the highest score gets repaired first. Every new hardware generation needs a new set of rules.
The authors built a graph neural network, a model that learns from data shaped as nodes and links. Each machine becomes a graph of its parts, cables and test results. Text from error logs is turned into numbers by Gecko, a Google text-embedding model, so a symptom that is renamed on a new platform still looks similar to the model.
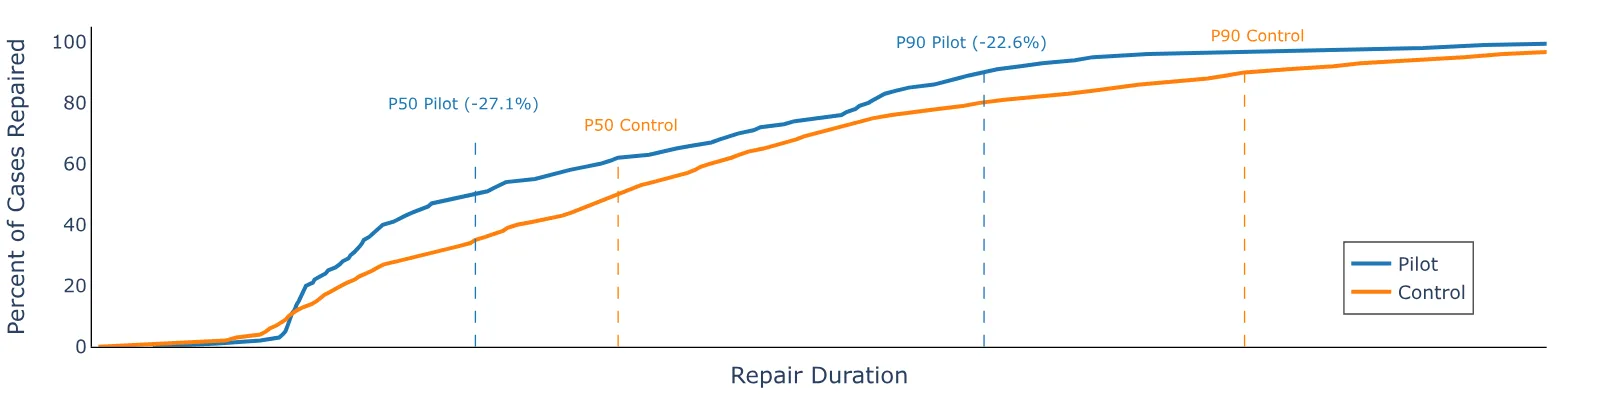
The authors report a live A/B test, in which machines were randomly sent to either the new model or the old rules. On Nvidia H100 GPU machines, mean time to repair fell by 18.3%. On a newly introduced TPU platform it fell by 16.1%. The share of cases diagnosed without a human rose by about 10 percentage points on both.
Offline tests on Google's own held-out data back up a second claim. A model pretrained on H100 data and then tuned on the newer H200 reached the same accuracy with about 10 times fewer labelled examples. The authors say this let the system be ready before the H200 went on general sale, instead of about four months after.
Our reading
In our reading, the strongest evidence here is the live A/B test. Random assignment against a working production system is rarer than an offline benchmark score, and it measures what operators care about: hours a machine spends out of service.
The TPU result is the firmer one. It rests on 2,567 repair windows and a narrow error band. The H100 result rests on only 225 windows, and its error band is plus or minus 7.6 points, so the true gain could be much smaller than 18%.
The design idea is easy to state. The model sees where a fault sits in the machine, not just which alarms fired. One example from the paper: if two GPUs on the same PCIe chain, the data link that connects them, vanish together, the model points at the shared chain. If they sit on different chains, it points at the GPUs. Fixed rules handle this kind of case poorly. On our readiness scale we rate this work II, Benchmarked, and only loosely: results are reported on private data, not a public benchmark, and nothing is released.
Read the rest of this story
Membership is free. You get every article in full and the Issue every Sunday.
We send a sign-in link, no password needed. Already a member? Sign inReadiness assessment
| Level | Status | Evidence |
|---|---|---|
| I Lab only | Met | The architecture, training objectives and graph design are described in enough detail to follow the idea. Appendices E, F and J add schemas and formulas. |
| II Benchmarked | Met | Offline results on Google's held-out data are reported across six platforms, with ablations against GNN variants and non-graph baselines. These are not public benchmarks. Level 2 is met only loosely: no public benchmark exists and the data is proprietary. |
| III Open source | Not yet | No code, weights or data are released. The limitations appendix says the telemetry cannot be shared and replication is constrained. |
| IV In production | Not yet | The paper reports production use at Google (six platforms, 50+ clusters, 6 months) and a live A/B test. That is documented use by a named organisation, but the paper is the authors' own report, not a third-party or independently documented deployment. It is also unclear whether it would count as proven given the small H100 sample. We have not proposed Level 4 for this reason. |
What would move it up
To reach Level 3, Google would need to release code, weights or a sanitised or synthetic dataset. To make Level 4 firm, it would need longer-run published results with test dates, larger samples on H100, or independent corroboration, plus evidence that the success-rate (action recommendation) mode runs in production. A public benchmark for datacenter repair would also help.
The study
Yuanlin Wen, Elan Markowitz, Zubo Gu et al.. HardwareDx: A Foundational Graph Model System for Datacenter Machine Repairs. arXiv, 17 November 2026. Read the paper
Notes
- Wen, Markowitz et al., 'HardwareDx: A Foundational Graph Model System for Datacenter Machine Repairs', arXiv preprint, November 2026, CC BY 4.0. The paper lists NeurIPS 2026 in its footer. Source
- No code, weights or data have been released.
- A/B results (Table 1): mean time to repair down 18.3% ± 7.6% on H100 (225 windows) and 16.1% ± 2.6% on TPU (2,567 windows). QA delivery time down 28.3% ± 10.7% (H100) and 25.1% ± 2.5% (TPU). Automated diagnosis 83.1% to 93.9% (H100), 72.9% to 82.8% (TPU). ± is one standard error.
- Offline readiness on H200 (Table 2): job-level accuracy four months after general availability 0.942 for the new model, 0.749 for the previous model generation; rules at launch 0.596.
- Ablations on TPU v7x (Table 3): full model F1 0.990; without language-model features 0.444; gradient boosted trees 0.540; MLP 0.514; graph network without transformer 0.985.
- Readiness: II Benchmarked, loosely. Results are on private held-out data, not a public benchmark. Level III not met (nothing released). Level IV not proposed: production use at Google is self-reported by the authors only.
Edited and signed by
Stefan PerdalEditor and publisher86 stories editedStefan read the study, set the readiness level and approved this story. An AI system found the paper and wrote the first draft.
How this was made
An AI model read the study and wrote this article in the structure Science Underway uses. An editor reviewed it and approved it for publication. Check the original study before you rely on the details.
How we workNo corrections