Google's PARDIG maps global rainfall, trained only on satellite radar
A Google DeepMind and Google Research model turns weather data and satellite images into rain maps every 15 minutes. In the authors' tests it beats the main existing products, most clearly in heavy rain. The paper is a preprint and has not been peer reviewed.

What the study shows
Knowing where rain falls, and how hard, matters for flood warnings, farming and water planning. Rain gauges and ground radars are accurate but cover only a small, mostly wealthy part of the world. Global rain maps therefore lean on satellites and weather models, and each existing product has weak spots.
PARDIG is a neural network, a type of AI model that learns patterns from examples. It takes two kinds of input. One is a weather model's picture of the atmosphere, such as temperature, wind and humidity. The other is images from geostationary satellites, which sit over a fixed point and photograph clouds every 30 minutes.
To learn what rain looks like, the model is trained on readings from a radar on NASA's GPM satellite. That radar measures rain precisely but only along a narrow strip, revisiting each place every few days. The model learns from these scattered readings, then fills in the whole globe every 15 minutes on a grid of about 10 km. It never sees ground radar or rain gauges, so those can be used as a fair test.
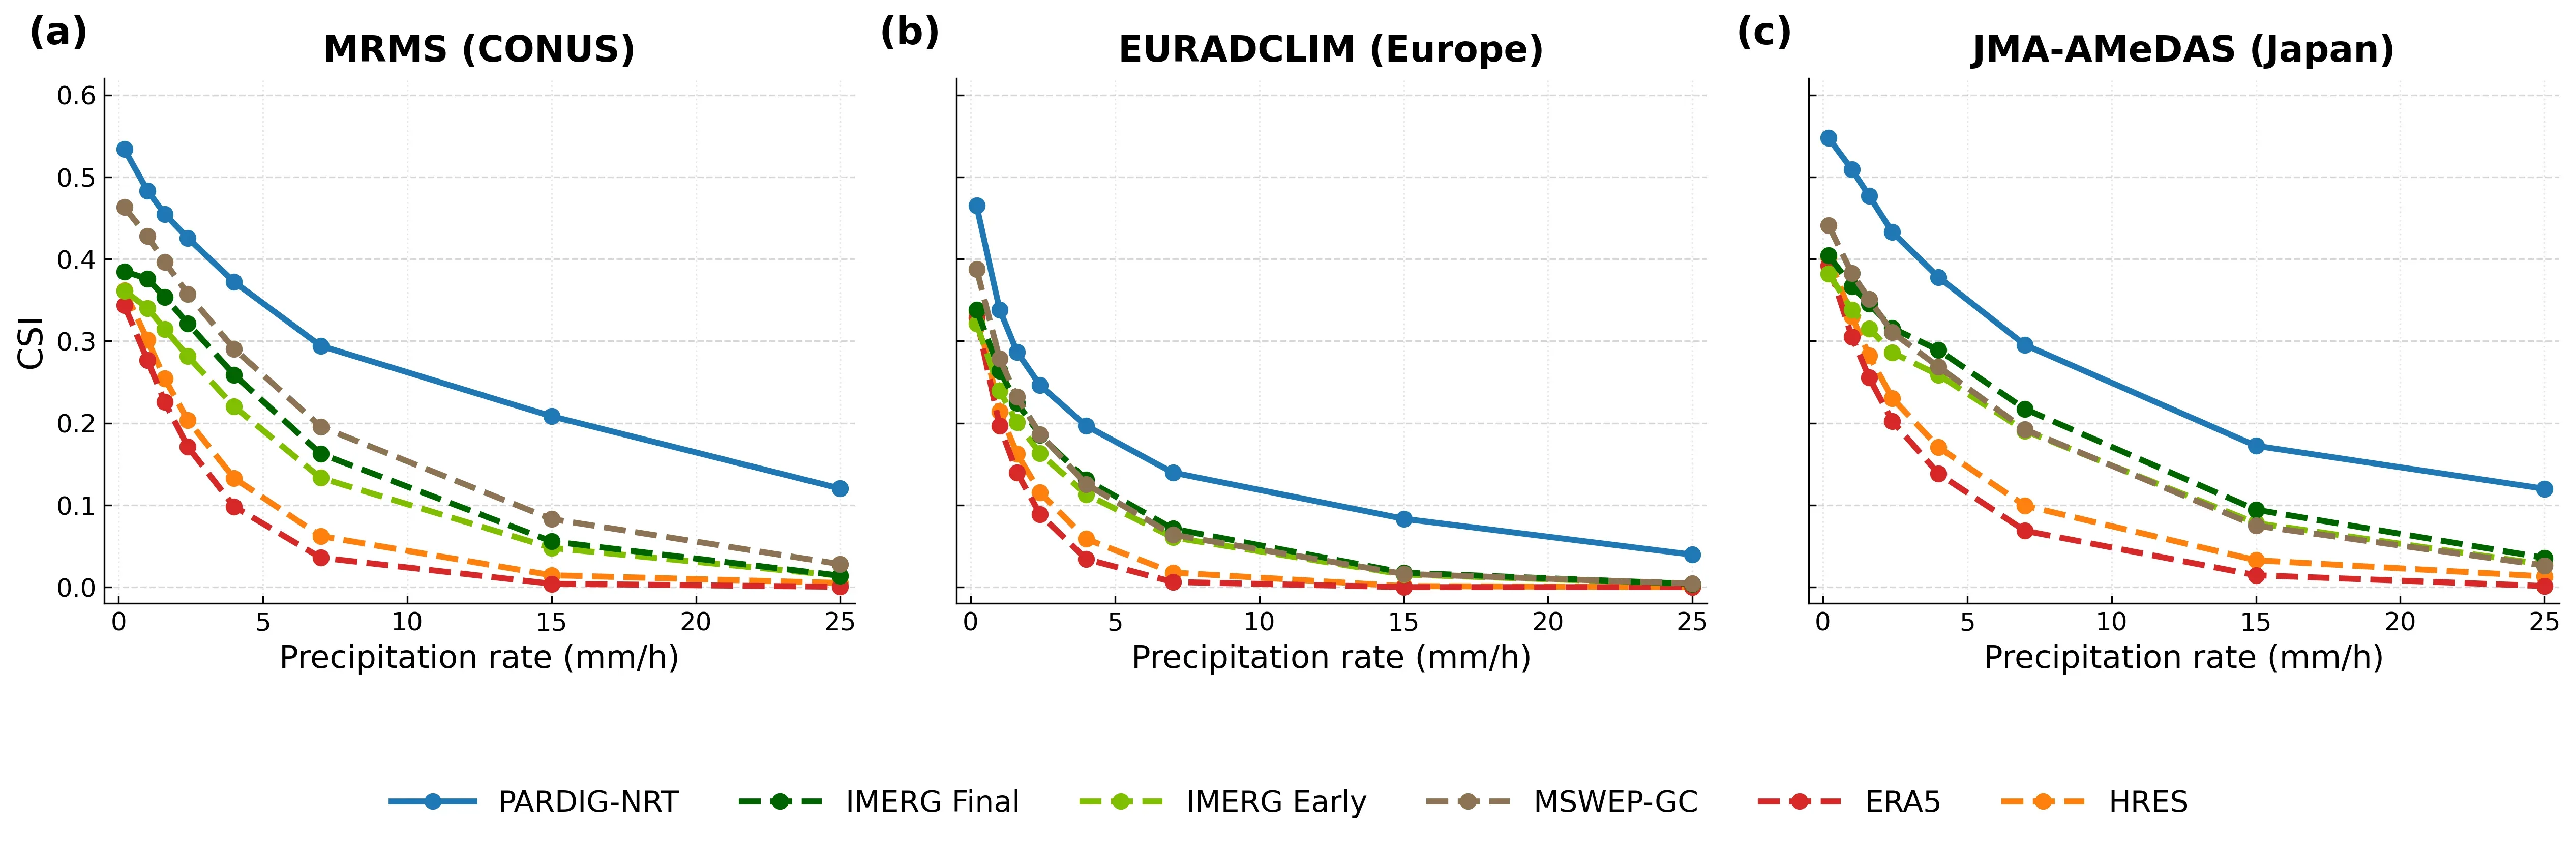
The authors compared PARDIG with five existing products: two versions of NASA's IMERG satellite product, the MSWEP blended product, and two weather-model products from ECMWF, the European forecasting centre. The main score was the Critical Success Index (CSI), from 0 to 1, which punishes both missed rain and false alarms.
Against ground radar in the US, Europe and Japan, PARDIG scored highest at every rain intensity tested. Over the US, for moderate hourly rain, it scored 0.48 against 0.43 for the best rival. For very heavy rain the gap was larger: 0.12 against 0.03 or less for every rival.
Against 36,678 rain gauges worldwide, PARDIG beat NASA's IMERG Final at about nine in ten stations. The gain was largest in the tropics. Against MSWEP, which itself uses gauge data, PARDIG won at about two thirds of stations, but the margin outside the tropics was small.
Skill held steady in 2024 and 2025, after the training data ended. A version of PARDIG also improved rain forecasts in Google's WeatherNext 3 forecasting model. Both a near-real-time stream from 2016 and a historical record back to 1999 are freely available under an open licence.
Our reading
In our reading, the central idea is sound and useful: train on a small amount of very good data, then apply it everywhere using inputs that cover the whole globe. Because ground radar and gauges are kept out of training, they become an honest exam. That is a cleaner test than many products allow, since some of them use the same gauges they are later scored against.
The heavy-rain results are the most striking. Existing products almost never catch the most intense hourly downpours, which are the ones that cause flash floods. PARDIG catches a modest share of them. Its case study of the July 2025 Texas flash floods shows the pattern: at heavy rain rates its event score was 0.29 against 0.08 for IMERG Final.
Readiness: we rate this level II, Benchmarked. The authors report results on public radar networks, public gauge data and public baselines. The rain maps themselves are openly released, which is valuable. But the paper does not say the model weights or training code are released, so it does not meet our level III test. No outside organisation is documented using it, so level IV is not met.
Read the rest of this story
Membership is free. You get every article in full and the Issue every Sunday.
We send a sign-in link, no password needed. Already a member? Sign inReadiness assessment
| Level | Status | Evidence |
|---|---|---|
| I Lab only | Met | The method is described in detail: architecture, training on GPM footprints, rain-rate conversion, and ablation-style design choices. |
| II Benchmarked | Met | Evaluated against three independent public radar networks, 36,678 gauge stations and public baselines (IMERG V07, MSWEP V3, ERA5, HRES). Results include per-threshold CSI tables and 2024 to 2025 held-out years. Not peer reviewed, and the evaluation was run by the authors. |
| III Open source | Met | The estimates are released under CC BY 4.0 as Zarr datasets at gs://pardig_1/NRT/ and gs://pardig_1/LR/, and in Google Earth Engine, with documentation online. Model weights and training code are not stated as released, so this is open data, not open source code. |
| IV In production | Not yet | No named organisation is reported using PARDIG operationally. A near-real-time stream is run by the authors, and a version fed the WeatherNext 3 precipitation head (Google's own model). No external deployment is documented. |
What would move it up
To reach level 4, a named outside organisation (a weather service, hydrology agency or insurer) would need to document using the PARDIG stream in operations. Peer review, independent evaluation by non-authors, validation over oceans and sparsely gauged land, and released weights or code would also strengthen the case.
Checked automatically every week, last on 16 November.
The study
Guy Shalev, Stephan Rasp, Boris Babenko et al.. PARDIG: Global Precipitation Estimates Learned from Sparse Satellite Observations. arXiv, 10 November 2026. doi:10.48550/arxiv.2611.13941
Notes
- Shalev, Rasp, Babenko et al. PARDIG: Global Precipitation Estimates Learned from Sparse Satellite Observations. arXiv preprint 2611.13941, November 2026. Not peer reviewed. Source
- Data documentation and access instructions. Datasets released under CC BY 4.0 as Zarr files at gs://pardig_1/NRT/ and gs://pardig_1/LR/, and in Google Earth Engine. Model weights and code are not stated as released. Source
- US radar, 1 mm/h hourly CSI (2016 to 2023): PARDIG-NRT 0.48, MSWEP-GC 0.43, IMERG Final 0.38, ERA5 0.28. At 25 mm/h: PARDIG-NRT 0.12, all baselines 0.03 or less (Figure 2, Table A.10.1).
- Gauges: 36,678 stations, 2018 to 2023, 1 mm/h. PARDIG-NRT beats IMERG Final at 89.9% of stations, loses at 4.6%; mean CSI 0.36 against 0.28. Tropics and subtropics (2,841 stations): wins at 96.8%. Against MSWEP-GC: wins at 65.4%, loses at 19.9%; mean CSI 0.36 against 0.33.
- Held-out years: US 1 mm/h CSI 0.49 (2024) and 0.48 (2025) against 0.48 in 2023; Japan 0.51 and 0.49. Against GPM, 1 mm/h CSI about 0.51 in training years and 0.47 in 2024 to 2025.
- Texas July 2025 event CSI at 15 mm/h: PARDIG-NRT 0.29, IMERG Final 0.08 (Table A.10.3).
- WeatherNext 3: about 15% lower CRPS than the IMERG-trained head and about 30% lower than the analysis-based head, at 6 h lead against 6 h US radar totals. Used an earlier internal PARDIG version.
- Latency 2 to 8 hours; measured 2.2 to 7.6 hours, mean 4.9 hours, on 7 November 2026 (Appendix A.5).
- Suggested figure: Figure 2 (CSI against rain threshold for US, Europe, Japan) or Figure 3 (world map of per-station gains). Paper licence CC BY.
Edited and signed by
Stefan PerdalEditor and publisher86 stories editedStefan read the study, set the readiness level and approved this story. An AI system found the paper and wrote the first draft.
How this was made
An AI model read the study and wrote this article in the structure Science Underway uses. An editor reviewed it and approved it for publication. Check the original study before you rely on the details.
How we workNo corrections